For decades, soil sampling has been considered one of the foundational practices in crop management. But for just as long, many growers have felt frustrated or even skeptical about its value. Maybe you’ve thought: “I used to sample, but I never saw the results I was promised.” Or perhaps: “Soil test numbers don’t seem to match what I see in the field.”
Those reactions are understandable. Traditional approaches, such as the 2.5-acre grid sampling introduced in the mid-1990s, were built before we had yield monitors and before today’s advanced agronomic tools. The concept was to raise overall fertility to a static level and assume that would even out performance across the field. In reality, results were inconsistent, yield benefits were hard to prove, and adoption of soil testing stalled.
Fast forward to today, and soil sampling looks very different. At Advanced Agrilytics, we don’t just pull samples on a grid and average the results. We account for the actual environments within your field. By combining machine-captured yield data with our Terraframing spatial analysis, we place sample points where soil moisture, organic matter, and elevation truly influence nutrient availability. That means your fertility plan isn’t built on generic numbers; it’s tailored to how crops really respond in each part of your field. The result is more precise recommendations that improve efficiency and help protect your yield potential in both wet and dry years.
Why the Location of a Soil Sample Matters
A soil test, at its core, measures the chemical concentrations (nutrients and pH) and physical properties (organic matter and cation exchange capacity, or CEC) of the soil. That’s valuable information, but it doesn’t tell the whole story.
Think about it this way: a nutrient concentration of 25 ppm phosphorus (P) doesn’t have the same meaning everywhere in your field. On higher ground with lighter soils, plants may struggle to access that P during dry periods. Meanwhile, in a lower, wetter spot with more organic matter, the same amount of P might be much more available to the plants.
That’s why the placement of your soil sample points is so critical. If your samples aren’t located with these differences in mind, the results may not reflect how your crop actually experiences the soil. And if your data isn’t accurate, it’s impossible to design nutrient management and seeding strategies that will deliver the best performance and ROI.
This is where Terraframing makes the difference. Unlike grid-based or random sampling approaches, Terraframing uses multiple layers of sub-acre environmental data, including yield history, topography, organic matter, and CEC, to define unique environments within each part of the field. Soil sample points are then strategically placed in those environments, ensuring the results reflect how each zone truly functions in terms of nutrient availability and loss.
The Role of Yield Data in Soil Sampling
One of the biggest advances in soil sampling is the integration of machine-captured yield data. Yield monitors give us a direct measure of how much grain was harvested in each part of the field, and therefore, how many nutrients were taken out of the soil by the crop.
Instead of assuming nutrient removal is uniform across acres, Terraframing allows us to align soil sampling with yield data at the sub-acre level. That enables us to see:
- Exactly how much P, K, and other nutrients last year’s crop took out of the soil.
- Where the biggest nutrient deficits exist.
- How those deficits interact with soil characteristics like organic matter, CEC, and elevation.
This connection between yield data and soil sampling is what turns soil test results into actionable information. Instead of asking, “What’s in my soil?” you can start asking, “What did my crop take out, and how do I replace it where it matters most?”
How Soil Moisture Shapes Nutrient Availability
Even when two soil zones test at the same nutrient concentration, plant uptake can differ dramatically depending on soil moisture.
Some nutrients, like nitrate and sulfate, move with soil water toward plant roots (a process called mass flow). Others, such as phosphorus (P) and potassium (K), are less mobile and rely on diffusion, from high concentration zones in the soil to areas of lower concentration near the root. Diffusion depends heavily on soil moisture.
When soils dry out, the movement of P and K slows down, limiting availability to the plant. That’s why K deficiency often shows up first on higher ground in dry years.
Through Terraframing, Advanced Agrilytics integrates soil moisture dynamics into sampling strategy. By accounting for organic matter, CEC, and landscape position, we can anticipate when and where nutrient stress might occur. This means your fertility program is not just based on numbers in a lab report, but on how your plants will actually experience nutrient availability in the field.
Beyond Static Critical Levels: The Terraframing Advantage
Many fertility prescriptions still rely on a static “critical level,” which is a soil test threshold where adding more nutrients is thought to no longer increase yield. The problem is that this assumes nutrient availability is the same across all acres, which we know isn’t true.
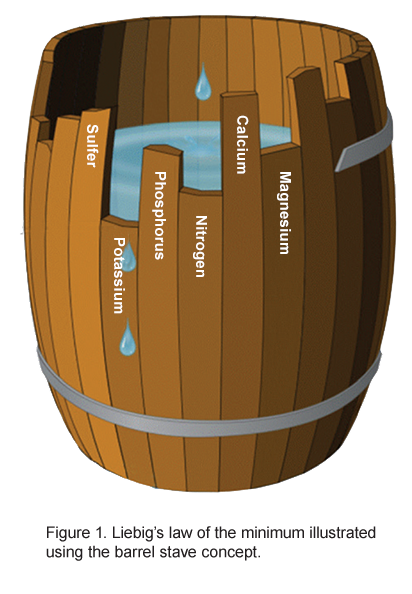
Illustration of Liebig’s Law of the Minimum showing a wooden barrel with staves of different heights. Each stave represents a nutrient or growth factor, and the shortest stave determines how much water the barrel can hold, symbolizing how the most limiting nutrient restricts crop yield. Advanced Agrilytics applies this concept through Terraframing, analyzing sub-acre environments to identify limiting factors influenced by soil moisture, organic matter, and yield variability.
Advanced Agrilytics takes a different approach by applying a spatial critical level, powered by Terraframing. This method considers not only the soil test concentration, but also the field’s moisture-holding characteristics and landscape position. For example:
- A zone with lower organic matter and higher elevation may reach nutrient stress at a higher soil test value than a lower, wetter zone.
- Fertility recommendations can then be tailored to each environment, rather than applying one blanket rule across the field.
This sub-acre precision is only possible with Terraframing. By mapping environments that influence nutrient movement and availability, we can direct inputs where they’ll have the greatest impact and avoid unnecessary applications where they won’t.
Nitrogen Mineralization and Variability
Soil organic matter isn’t just about moisture retention; it also influences nitrogen availability through mineralization. Depending on conditions, organic matter can release anywhere from 30 to 150 pounds of nitrogen per acre during the growing season.
That’s a substantial range, and it varies not just from field to field, but from sub-acre to sub-acre, within the same field. With Terraframing, we can spatially understand organic matter and moisture dynamics, allowing us to create variable rate nitrogen (VRN) prescriptions that improve yield potential and stabilize performance across both wet and dry years.
Bringing It All Together
So, what does modern soil sampling mean for growers? It means moving beyond static numbers and averages, and instead using more detailed, strategically placed soil sampling as part of adopting the Advanced Agrilytics methodology. The benefits are clear:
- Yield data shows us exactly which nutrients were removed from the soil and how to optimize nutrient applications through variable rate technology.
- Using TerraFraming to determine soil sample placement ensures that soil test results reflect real-world conditions in each environment.
- Moisture and soil properties explain nutrient availability, not just nutrient concentration.
- Sub-acre prescriptions tailor nutrient applications to the specific conditions of each part of the acre.
When these pieces come together, soil sampling becomes a powerful tool to help growers increase their nutrient efficiency and the ROI they get on their nutrient expenditures.
Ready to take your soil sampling to the next level? Contact us here to learn more.
© 2025 Advanced Agrilytics Holdings, LLC. All rights reserved. Advanced Agrilytics and design are trademarks of Advanced Agrilytics Holdings, LLC.