Editor’s Note: Recently, Advanced Agrilytics hosted a webinar on Maximizing Nutrient Efficiency Amid Rising Input Costs. This blog article is the second in a series drawn from that discussion, and it focuses specifically on how growers can make the most of their nitrogen investment. This article features insights from Advanced Agrilytics’ Chief Innovation Officer, Dr. Kess Berg.
| Did you miss the first article in this series? No problem – you can read it here! |
In today’s tough farm economy, every penny counts more than ever. That reality makes it more important than ever to understand nitrogen efficiency, the role of the nitrogen cycle, and the decisions that influence how much of your applied nitrogen actually makes it into the crop.
The State of the Farm Economy
Corn and soybean growers today are caught in a vicious tug-of-war between low commodity prices on one side and high input costs on the other. Four key factors are driving this pressure:
- Volatile input costs: Nitrogen prices spiked from $178 per ton in 2021 to more than $400 in 2023 before settling near $270 in 2024, creating major planning uncertainty.
- Sluggish commodity prices: USDA’s monthly World Agricultural Supply and Demand Estimates (WASDE) continue to project ample commodity supplies, keeping corn and soybean prices under pressure.
- Market disconnects: Many analysts argue USDA models understate the impact of disease (such as southern rust) and late-season drought stress, meaning actual yields may be lower than official forecasts.
- Slow global demand: Softer export demand has capped rallies and left margins razor-thin even as costs remain high.
In this environment, maximizing nitrogen efficiency isn’t just good agronomy; it’s essential risk management. Every pound of N must be positioned to deliver maximum return.
The Nitrogen Cycle: Why It’s Complicated
The challenge with nitrogen isn’t just its cost, it’s the fact that nitrogen is dynamic and rarely stays in one form for long. Once applied, it transitions through different chemical forms and moves within the soil–plant–atmosphere continuum, influenced by temperature, moisture, microbial activity, and soil properties.
Two key forms of plant-available nitrogen illustrate this balance:
- Ammonium (NH₄): Positively charged, it binds to negatively charged soil particles. This makes it relatively stable and less prone to leaching, but it’s also less mobile in the soil profile. Without moisture movement, ammonium may not move into the root zone efficiently.
- Nitrate (NO₃): Negatively charged, it does not bind to soil particles and moves freely with soil water. This mobility is a double-edged sword. On one hand, it allows corn and soybeans to take up large amounts of nitrogen rapidly during periods of peak vegetative growth. On the other hand, it’s also what makes nitrate highly vulnerable to loss through leaching and denitrification.
This is why timing and placement of nitrogen applications are so critical. To maximize efficiency, nitrogen has to be available in the right form, at the right place in the soil profile, and at the right time to meet crop demand. Too much nitrate present too early raises the risk of loss; too little available when uptake accelerates can cap yield potential.
Finding the Right Nitrogen Rate
So how do you determine the “right” rate? Kess described it as a simple but powerful equation:
Optimal N Rate = (Total Crop N Requirement) – (Organic Matter Contribution) + (Potential N Loss)
- Total Crop N Requirement depends on crop type and rotation. For example, corn following soybeans typically requires less N than corn-on-corn.
- Organic Matter Contribution varies across a field. In some areas, organic matter might release 30 to 40 lbs. N per acre; in others, more than 100 lbs. per acre.
- Potential N Loss is highest in wetter, low-lying areas. These zones may benefit from stabilizers, split applications, or adjusted timing.
Figure 1: Advanced Agrilytics’ Proprietary Nitrogen Loss Potential (NLP) Layer Allows Understanding of the Nitrogen Cycle at a Very Granular Level
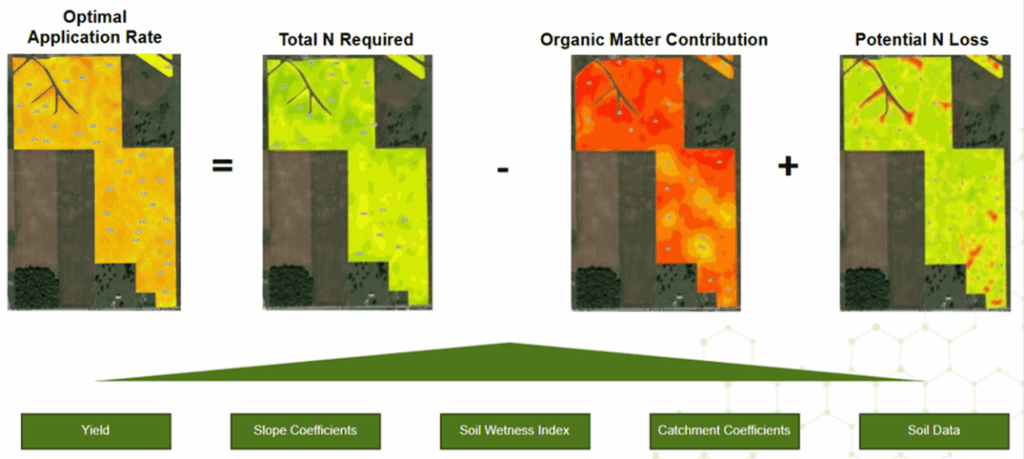
The patented algorithms within TerraFraming® take multiple datasets into consideration, including yield, slope coefficients, the Soil Water Index (SWI), catchment coefficients and soil data to spatially calculate the Organic Matter Contribution and Nitrogen Loss Potential.
By layering these factors spatially, growers can move beyond blanket rates to a more precise, environment-specific nitrogen strategy.
How TerraFraming Improves Nitrogen Decisions
Determining the right nitrogen rate requires more than a formula. It requires the ability to measure and map the factors in that formula at a sub-field scale. That’s where Advanced Agrilytics’ TerraFraming® system comes in.
TerraFraming analyzes multiple data sets such as soil type, slope, topography, organic matter levels, and water movement. This builds a spatial picture of how nitrogen is likely to behave in different parts of the field. Two layers within TerraFraming are especially valuable for nitrogen planning:
- Organic Matter Contribution Layer: This layer identifies how much nitrogen each part of the field is likely to release through organic matter mineralization.
- Nitrogen Loss Potential (NLP) Layer: Not all catchment areas behave the same. Some zones shed water quickly, while others remain saturated and prone to denitrification or leaching. The NLP layer accounts for these differences, allowing growers to see exactly where nitrogen is most at risk of loss. With this information, stabilizers, split applications, or rate adjustments can be targeted to the zones where they’ll deliver the best ROI.
By integrating these insights, TerraFraming helps growers replace one-size-fits-all application strategies with precision plans that align nitrogen supply with crop demand and field environment.
Why Timing Matters
Timing isn’t just about logistics. It’s about synchronizing nutrient supply with crop demand.
For example, corn’s nitrogen uptake rate increases sharply around the V6 stage, during rapid vegetative growth. If sufficient N isn’t available at that moment, yield potential is compromised. On the other hand, applying too much nitrogen too early increases the risk of loss before the crop can use it.
Beyond Nitrogen: Looking at the Whole System
One of the recurring themes of the webinar was that nitrogen efficiency doesn’t exist in isolation. Root development, P and K levels, moisture availability, tillage practices, and even decisions about fungicide treatments all influence whether nitrogen is effectively converted into yield.
For example:
- Poor root systems: whether due to compaction, crusting, or shallow growth, poor root system development can limit nutrient uptake even when nutrient soil concentrations are high.
- Fungicide applications aimed at plant health may not deliver much ROI if the crop is already limited by P or K deficiencies.
- Residue management and rotation decisions (like corn-on-corn acres) can significantly affect how much nitrogen is needed and when it should be applied.
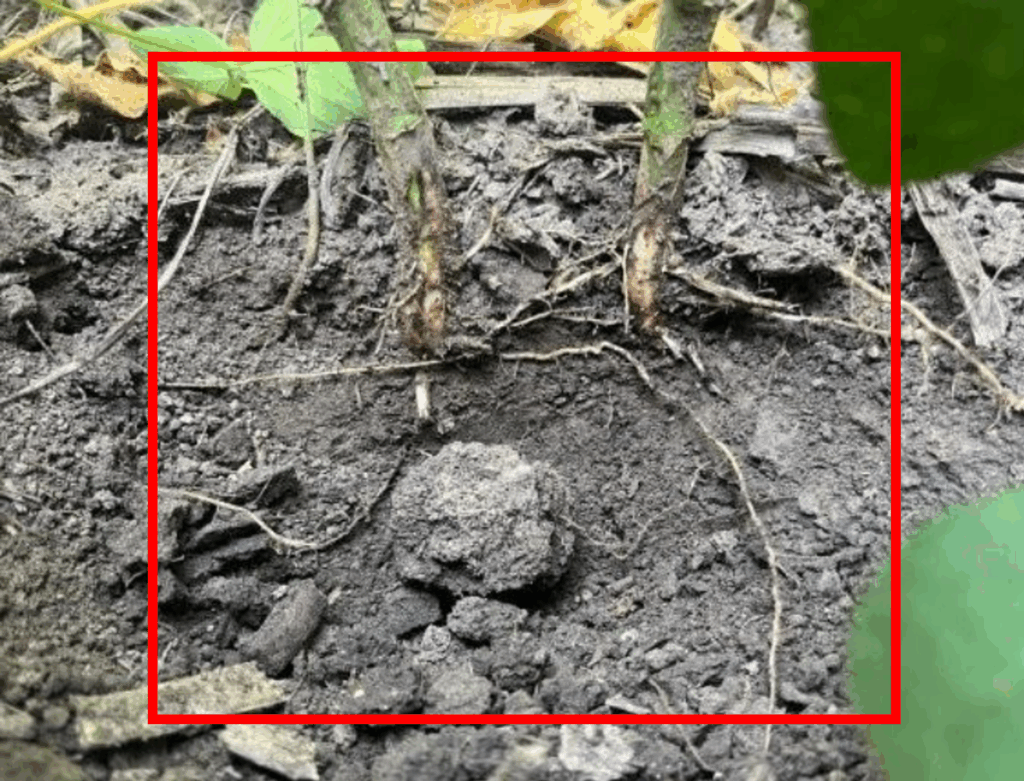
Poor root development is one of many factors that can diminish a plant’s ability to take up nutrients. In this example, this plant’s roots hit a compacted or crusted soil layer at approximately 2” deep in the soil profile. The young roots couldn’t penetrate the hard crust, resulting in stunted, shallow root development and inadequate root branching.
Advanced Tools: Modeling and Spatial Analysis
At Advanced Agrilytics, we use dense data collection and proprietary layers, such as our Nitrogen Loss Potential (NLP) layer, to help growers see risk and opportunity at the sub-acre level. These tools factor in soil data, slope, catchment, and moisture dynamics to identify where nitrogen is most likely to be lost and where it will be used most effectively.
That insight makes it possible to:
- Target stabilizers to zones that need them most.
- Adjust rates in fields with high organic matter contributions.
- Reallocate input dollars to the acres with the best ROI potential.
Key Takeaways for Growers
- Measure efficiency with multiple metrics. NUE and YPT together provide a clearer picture than either alone.
- Recognize the current economic reality. With high input costs and sluggish commodity markets, efficiency is a necessity, not a luxury.
- Understand product differences. Each nitrogen source has unique risks and benefits. Understand these variables and plan your nitrogen strategy accordingly.
- Respect the nitrogen cycle. Ammonium and nitrate behave differently, and both play roles in crop success.
- Refine rates with data. Use spatial insights to account for organic matter contributions and nitrogen loss potential.
- Match timing with demand. Synchronize nitrogen supply with critical growth stages like V6.
- Consider the whole crop management plan. The effectiveness of every pound of nitrogen depends on overall crop health, rooting, and other nutrients.
By integrating metrics, data layers, and a whole-farm management perspective, growers can make nitrogen decisions that deliver both agronomic and economic returns. Ready to learn more? Contact us here.
© 2025 Advanced Agrilytics Holdings, LLC. All rights reserved. Advanced Agrilytics and TerraFraming are trademarks of Advanced Agrilytics Holdings, LLC.