For large-acre corn and soybean growers across the Midwest, farming is both art and science, and every season begins with one big unknown: crop loss risk. From fluctuating weather to variable soil conditions and yield unpredictability, today’s growers need more than basic agronomic support. They need a science-backed, proven method of predictive agronomy.
At Advanced Agrilytics, we’ve spent more than a decade building just that. Our system is built on spatial agronomy, data-driven prescriptions, and continuous learning through our TerraFraming™ platform.
The result? Reduced yield variability, better ROI, and greater crop resilience.
A Decade of Corn and Soybean Yield Improvement
Dr. Kess Berg, Chief Innovation Officer with Advanced Agrilytics, recently presented the findings of an analysis performed by the company’s data science team. Led by Chief Science Officer Jon Fridgen, the team analyzed 10 years of yield performance and crop insurance data across Advanced Agrilytics customers, focusing on data from customers who are utilizing our full-service offerings (variable-rate nitrogen management, seeding, variable-rate nitrogen stabilizer prescriptions, lime/phosphorus/potassium prescriptions, etc.), and compared them with USDA benchmarks.
Specifically, our data science experts examined county yield data from the USDA National Agricultural Statistical Service (NASS) and crop insurance experience data from the USDA Risk Management Agency (RMA).
The data tells a pretty compelling story.
Figure 1: Removing Risk
Our goal is to reduce risk and create “whole farm” results, such as improved yield consistency and better crop resilience. The chart to the right shows the “at-risk” acres—those that historically underperform. Under Advanced Agrilytics management, we want to see the yield distributions of those underperforming acres shift to the right, indicating that yield risk is diminishing.
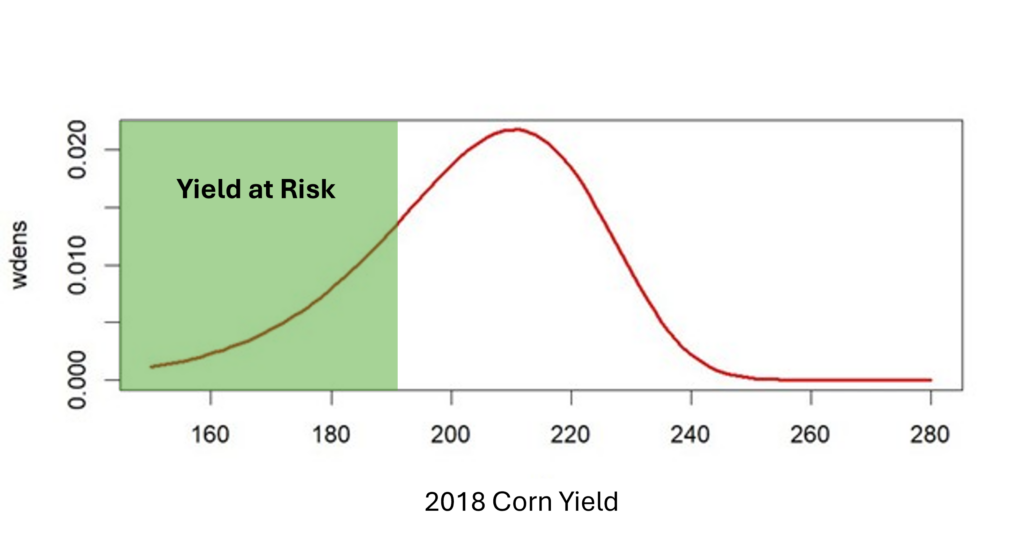
Figure 2: Combined Yield Distributions
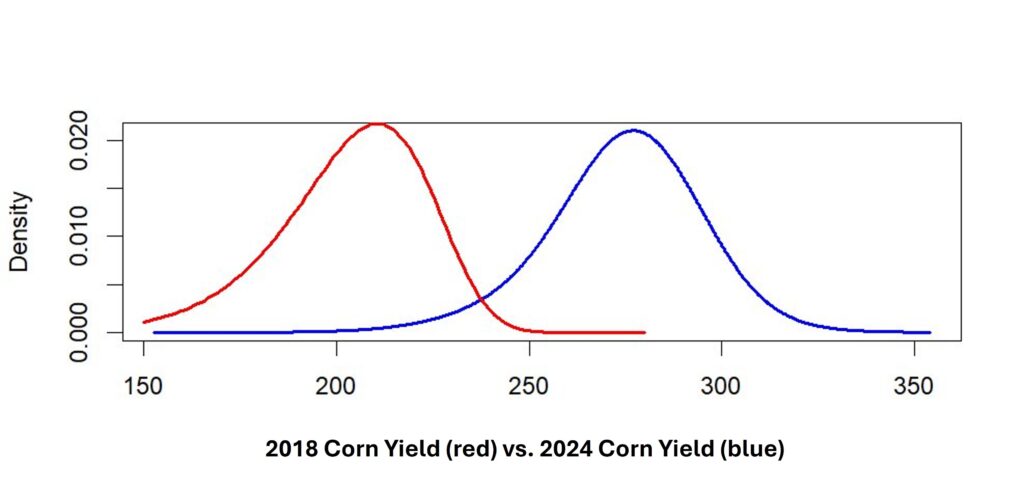
Our methodology narrows the gap between yield distributions (in other words, reducing yield variability) and shifts the distribution to the right, indicating higher yields. This graphic compares yield data from 2018 (represented by the red curve) to yield data from 2024 (represented by the blue curve). This shows that by using our predictive agronomic methodology, our customers decreased yield variability and saw consistently better yields over time.
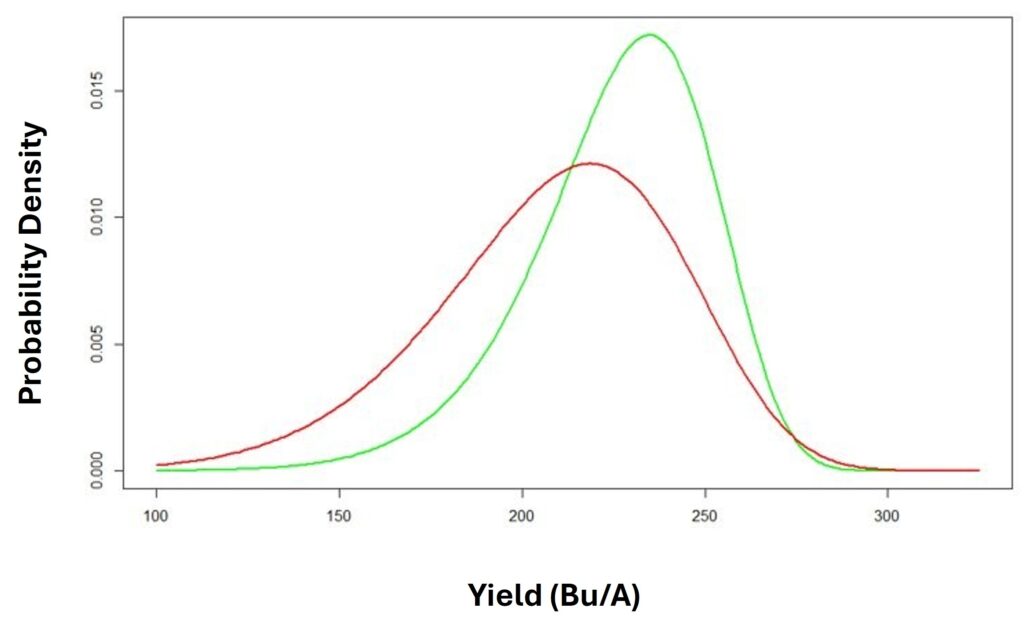
Figure 3: Overall Corn Results
The red curve represents yield distribution before Advanced Agrilytics management in this graphic. The green curve represents corn production under Advanced Agrilytics management. You can see the significant rightward shift in yield distribution after implementing Advanced Agrilytics management. In addition, there was a substantial reduction in the left tail of the yield distributions, indicating that production improved significantly on traditionally “poor-producing” acres.
Corn Yields Snapshot: A Shift Toward Higher, More Reliable Returns
- Approximately 30 Bu/A were removed from the “left tail” of the distribution – those poor-performing, high-risk acres that typically drag down farm averages (and profitability).
- By years 8-10, average gains reached approximately 25 Bu/A when compared to county averages.
- Even in difficult seasons like 2019, our growers fared better than the norm.
Figure 4: Overall Soybean Results
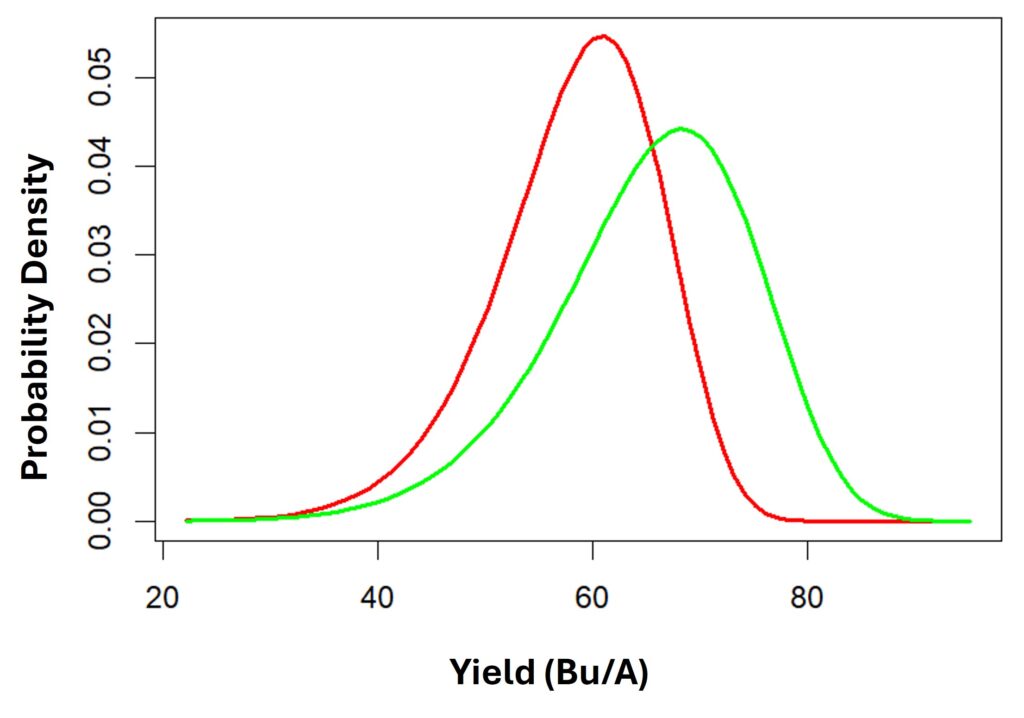
Similar to the results in corn production, we see a significant rightward shift in the yield distribution after the Advanced Agrilytics predictive agronomic method was implemented. Again, there was also a substantial reduction in the left tail of the graphic, indicating that approximately 4.7 Bu/A of soybeans were removed from the left tail, meaning lower risk and better overall production throughout the farm’s soybean acres.
Soybean Yield Snapshot: Smaller Gains, Same Stability
- A 4.7 Bu/A reduction in the left tail after implementing Advanced Agrilytics recommendations.
- Up to 5 Bu/A improvements seen by years 8-10.
- More consistent year-over-year performance, even under stressful weather conditions.
How do We do It? Managing Agronomic Risk at the Sub-Acre Level
Traditional agronomy tends to take a “one-size-fits-all” approach to every acre: static application rates of costly fertilizers such as nitrogen, phosphorus, and potassium across the entire farm or flat-rate seeding recommendations. At Advanced Agrilytics, we do the opposite.
Our TerraFraming platform employs patented spatial analysis methods that examine multiple datasets from each sub-acre of the field, to understand how the sub-acre environment influences crop performance in each part of the field. This analysis includes:
- Soil Wetness Index (SWI) to predict areas of a field prone to over-saturation (ie., low-lying or catchment areas) or drought-prone areas (knobs, for example).
- Nitrogen Loss Potential (NLP) modeling to identify areas of the field prone to denitrification, volatilization, or leaching.
- Spatial Critical Levels for phosphorus and potassium based on diffusion potential, not outdated grid sampling.
What Our Customers Say
Advanced Agrilytics customers will tell you – once you’ve experienced the Advanced Agrilytics method of predictive agronomy and seen the results, you’ll never farm another way.
Take it from Chris Lehe, who farms 5,000 acres of soybeans and popcorn in Indiana. He provided us with a case study of one particular, 350-acre field that had traditionally not performed well. After applying the Advanced Agrilytics methodology on this field for three years, he offered the following observations:
“The change in yield distributions in my operations is what really sold us on Advanced Agrilytics,” says Chris. “The percentage of acres that were in the lowest-yielding bracket dropped significantly. The percentage of acres that were in the upper distributions increased.
“To us, the most significant part of the equation was that there was a substantial increase in the percentage of acres that were near our median yield, and the median was closer to our top end than any of the previous years (when popcorn was planted in that field). Just comparing our yield distribution over all 350 acres and comparing that to the last five or six seasons we’ve grown popcorn in that field, it was obvious that we were making each acre far more efficient.”
Lower Insurance Risk = Higher ROI
Another benefit of using the Advanced Agrilytics predictive agronomy method – by producing more resilient, healthier crops that weather stressful conditions more successfully, growers can lower their risk loss potential.
This scatter plot illustrates the relationship between yield performance and crop insurance loss cost ratios—the higher the ratio, the greater the insurance payouts due to yield losses. The trendline for Advanced Agrilytics customers (represented by the green dots and the green trend line) shows a much flatter decline compared to the RMA/NASS-reported average. This means that as weather variability or other risk factors increase, Advanced Agrilytics growers’ yields remain more stable.
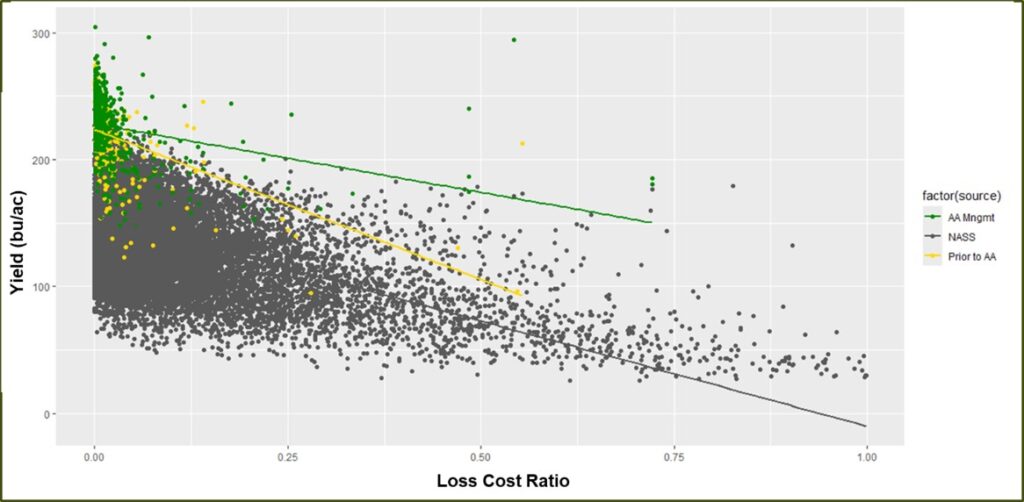
Each dot and trend line tells a story:
- Green dots represent current Advanced Agrilytics customers with acres under active management. The green trend line shows that the rate of yield decreases is not as steep for Advanced Agrilytics customers.
- Yellow dots show the same growers before partnering with Advanced Agrilytics.
- Gray dots reflect the broader population of all farmers as reported by USDA National Agriculture Statistics Service (NASS), serving as a national benchmark.
From "Problem Acre" to Profitable Acres
One of the clearest trends in our decade-long analysis: fields with historically poor performance now contribute positively to overall farm ROI. How?
- Tailored prescriptions improve nutrient availability and efficiency, creating crops that get off to a stronger start and are more resilient, even under stressful conditions.
- Precise, variable-rate input applications improve nutrient efficiency, minimize waste, making the farming operation both more productive and sustainable.
Conclusion: A Proven Path to Resilience
After a decade of results across corn and soybean systems, the message is clear: Advanced Agrilytics offers more than precision ag—it delivers predictive agronomy. And that leads to more-informed, data-driven decisions, more resilient crops, and a better bottom line.
© 2025 Advanced Agrilytics Holdings, LLC. All rights reserved. Advanced Agrilytics, TerraFraming, and designs are trademarks of Advanced Agrilytics Holdings, LLC.